


Why do families choose home education?
Insights from a survey of home educating families in early 2024

We first began seriously researching home education for our children in 2007; since then I’ve been a member of pretty much all the national support groups, from the days of yahoo groups and a 2 page A4 sheet of contacts through the post from Education Otherwise, to admin on the 50,000 strong Facebook group Home Education For All (HEFA). I’ve run a few different local social groups for home educating families for most of that time - we hit 90 attendees on a particularly glorious day this summer. After my eldest got caught up in the exam cancellation nightmare for private candidates in 2020, I became a trustee of the Home Educators’ Qualifications Association, and got involved in the varied details of home educator’s exams experiences.
Every day I see posts and stories from hundreds of different home educators across the country - sometimes a snippet from the middle of a story from a stranger, sometimes a decade long friendship. I feel fairly confident that I can express a viewpoint that is wider than my own.
But I’m also aware that any one person only sees so much of the story; and it is easy to notice the things you expect to see, and gloss over those you don’t. If I’m claiming something, I want to have as much evidence as possible that what I am saying is really true.
So I ran a survey, to try and collate as many different stories as possible, and check whether what I thought I saw was really the case (or at least be a little more confident in that). Any survey can only do so much on that front - it is limited and biased by those who see it, and those who choose to answer. And by definition, any family who home educates comes from that small slice of the population that do not currently use a school, and they probably differ from the 98% of children who continue to do so. Nonetheless, this slice is growing , and I think, if you’re interested in education and young people’s lives, it’s interesting to find out why that might be. And an in-depth look at 1200 children’s stories seems a good place to start.
This is absolutely not a formal university backed research project. This is just me, working alone, hoping to justify the trust families have leant to me to share their stories. One advantage of that is that I can publish information as I analyse it, and this will come out in a series of posts as I’m able to work on it - one disadvantage, of course, being that that may take some time!
We’ll begin with a look at how the survey was run, and who the families that answered the survey were.
Survey parameters
The survey ran from 16th February 2024 to 5th March 2024, with responses collected via Google Forms. The survey was advertised via multiple social media channels, with encouragement to share as widely as possible. However it is likely that respondents were weighted towards those who made significant use of social media for home education support, or were connected to other families who did. There’s an ongoing difficulty in capturing the full range of home education experience, in that parents who have not found networks of support may be under-represented.
Each survey response was in relation to a single child, so the same parent may have responded for multiple children.
Respondents were asked to confirm that they were currently home educating a child of Compulsory School Age. However some questions captured responses that fell outside this range - for example younger or older children, or children who had an EOTAS (Education Otherwise Than At School, provided by the Local Authority) arrangement, rather than EHE (Elective Home Education). No independent verification was made; however the range and detail of questions was such that inconsistent responses could be detected.
Study Participants
There were 1220 responses.
Responses were received from across the UK, with 1080 from England, 94 from Wales, 25 from Scotland, and 6 from Northern Ireland. Compared to the overall population, England is slightly over-represented, Wales is significantly over-represented, and Scotland and Northern Ireland are significantly under-represented. Other statistics suggest that the rate of home education is somewhat lower in Scotland and in Northern Ireland, but this pattern of representation is more likely to be due to the fact that Scotland and Northern Ireland have different home education regulations and therefore different networks. In general, all responses have been analysed, and where appropriate compared to the DfE data which only covers England, without reference to home nation.
Responses were received from across the UK.
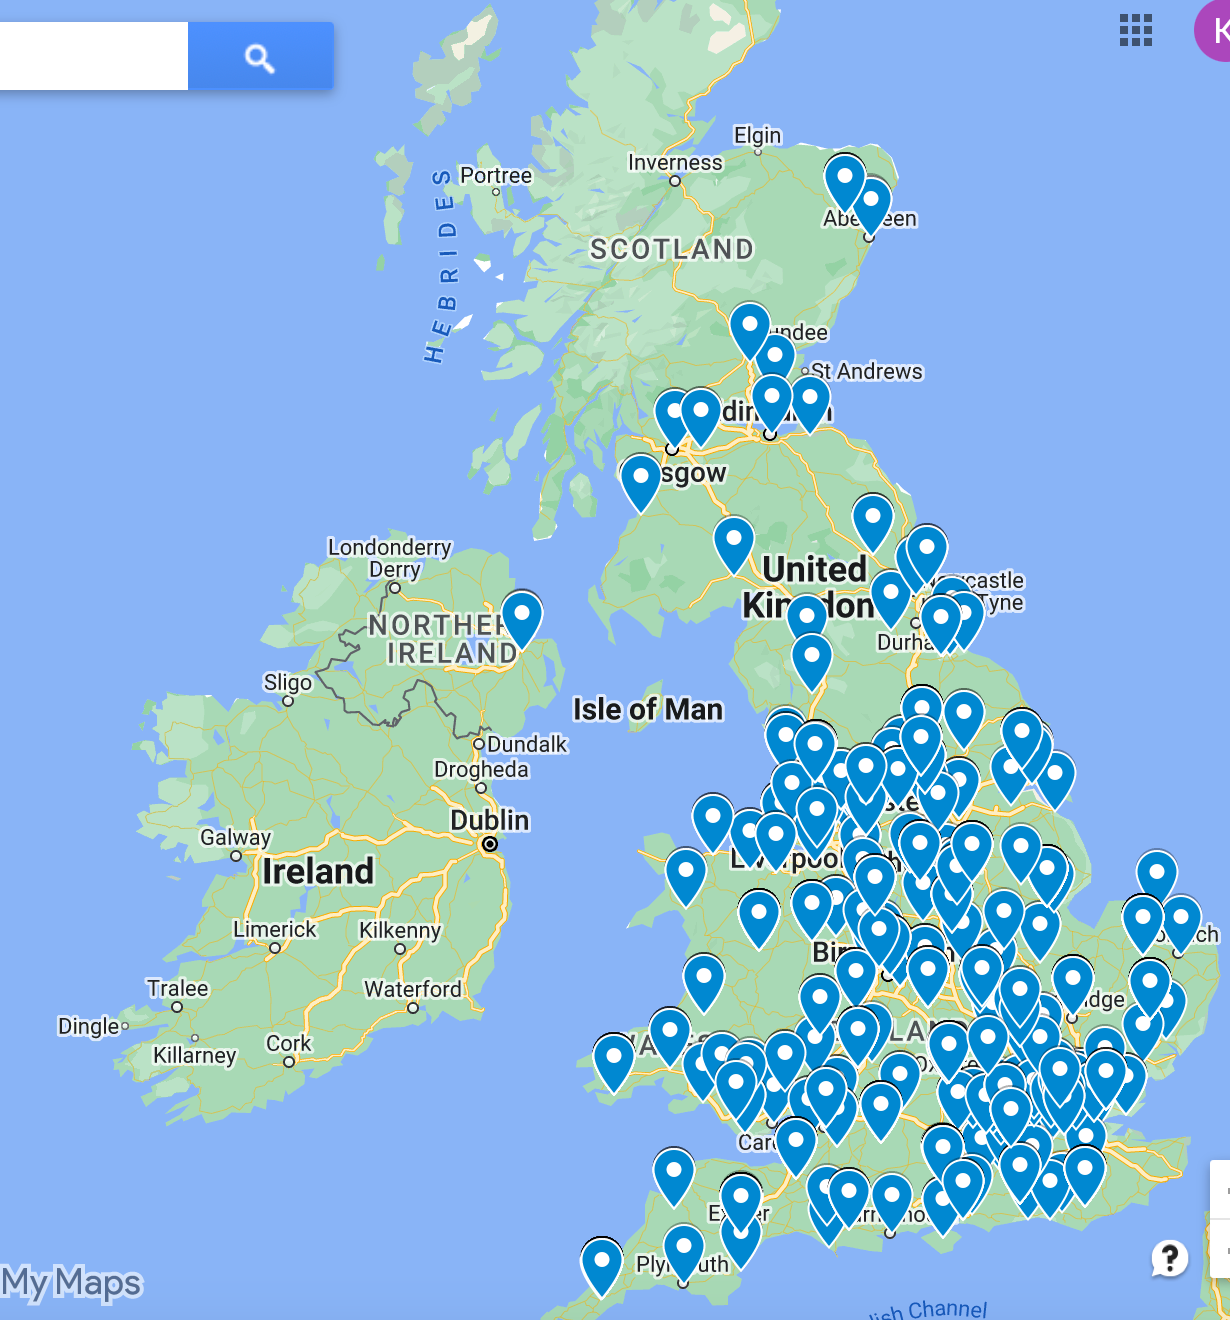
This wide distribution of respondents suggests the overall picture is unlikely to be distorted by local issues.
Age of home educated children
The current age distribution of respondents’ children is shown below.

This compares to the age distribution of the DfE data from the Autumn 23 census as follows:

In common with other data sources, children represented in this survey are more likely to be home educated at secondary ages than at primary ages. However, from this data alone, it’s not possible to tell whether this is because the same children remain home educating, and others are also deregistered in later years (which would lead to an increase as school years progressed), or whether there is a substantial increase in deregistrations in later secondary years. (DfE termly census data does allow a partial answer to this, and suggests that there are more net in-year deregistrations in later years.)
It’s important to note that this also shows that the survey responses are likely under-representative of the KS4 (Year 10 and 11) population. Comparing census responses in the DfE data, we know that a high proportion of children are home educated, and deregistered, in these years. The relative lack of representation of these children in this survey may be an indication that families deregistering at this stage are less likely to be linked in to support networks. It also suggests that a level of caution is required in extrapolating information about this age group.
Age home education started
DfE census data collects the current age of home educated children, as shown above, but does not give any way of coordinating this with age home education started, or length of time home educating.
This survey also asks about the age of children when they started home educating, and the length of time they have been home educated for. This allows other data to be analysed for any differences that emerge over time.
This shows the distribution of ages when home education began for all responses.

Splitting this into those who have been home educating long term (defined as over one year), and those who have been home educating short term (defined as less than one year) shows the following patterns.
Short term - less than one year

This matches an overall pattern of an increase in deregistration in secondary, and an under-representation of year 10 and year 11 respondents in the survey compared to the national data expectations. (However it should be noted that respondents were requested to refer only to children who were now in year 11 or below, and so a smaller proportion of a normal school year fell into the year 11 category.)
Long term - more than 1 year

Very long term (5 years+)

Bear in mind that the survey subjects were drawn from children still of Compulsory School Age (although a few respondents answered for children in year 12 or above), and so it is expected that younger start ages are more highly represented the longer home education has been going on.
This shows a clear subgroup of longer term 'first choice' home educators, who decide to home educate from before school age, or begin home education soon into school attendance, and continue long term.
Length of time home educating
The survey also asked for the length of time the child had been home educated for. All respondents are shown here. Note that the guidance asked for this to be from either the latest deregistration, or from when the child would have started school if they did not begin at a standard transition point. Note also that the time categories are logarithmic to more clearly identify the more recent deregistrations.
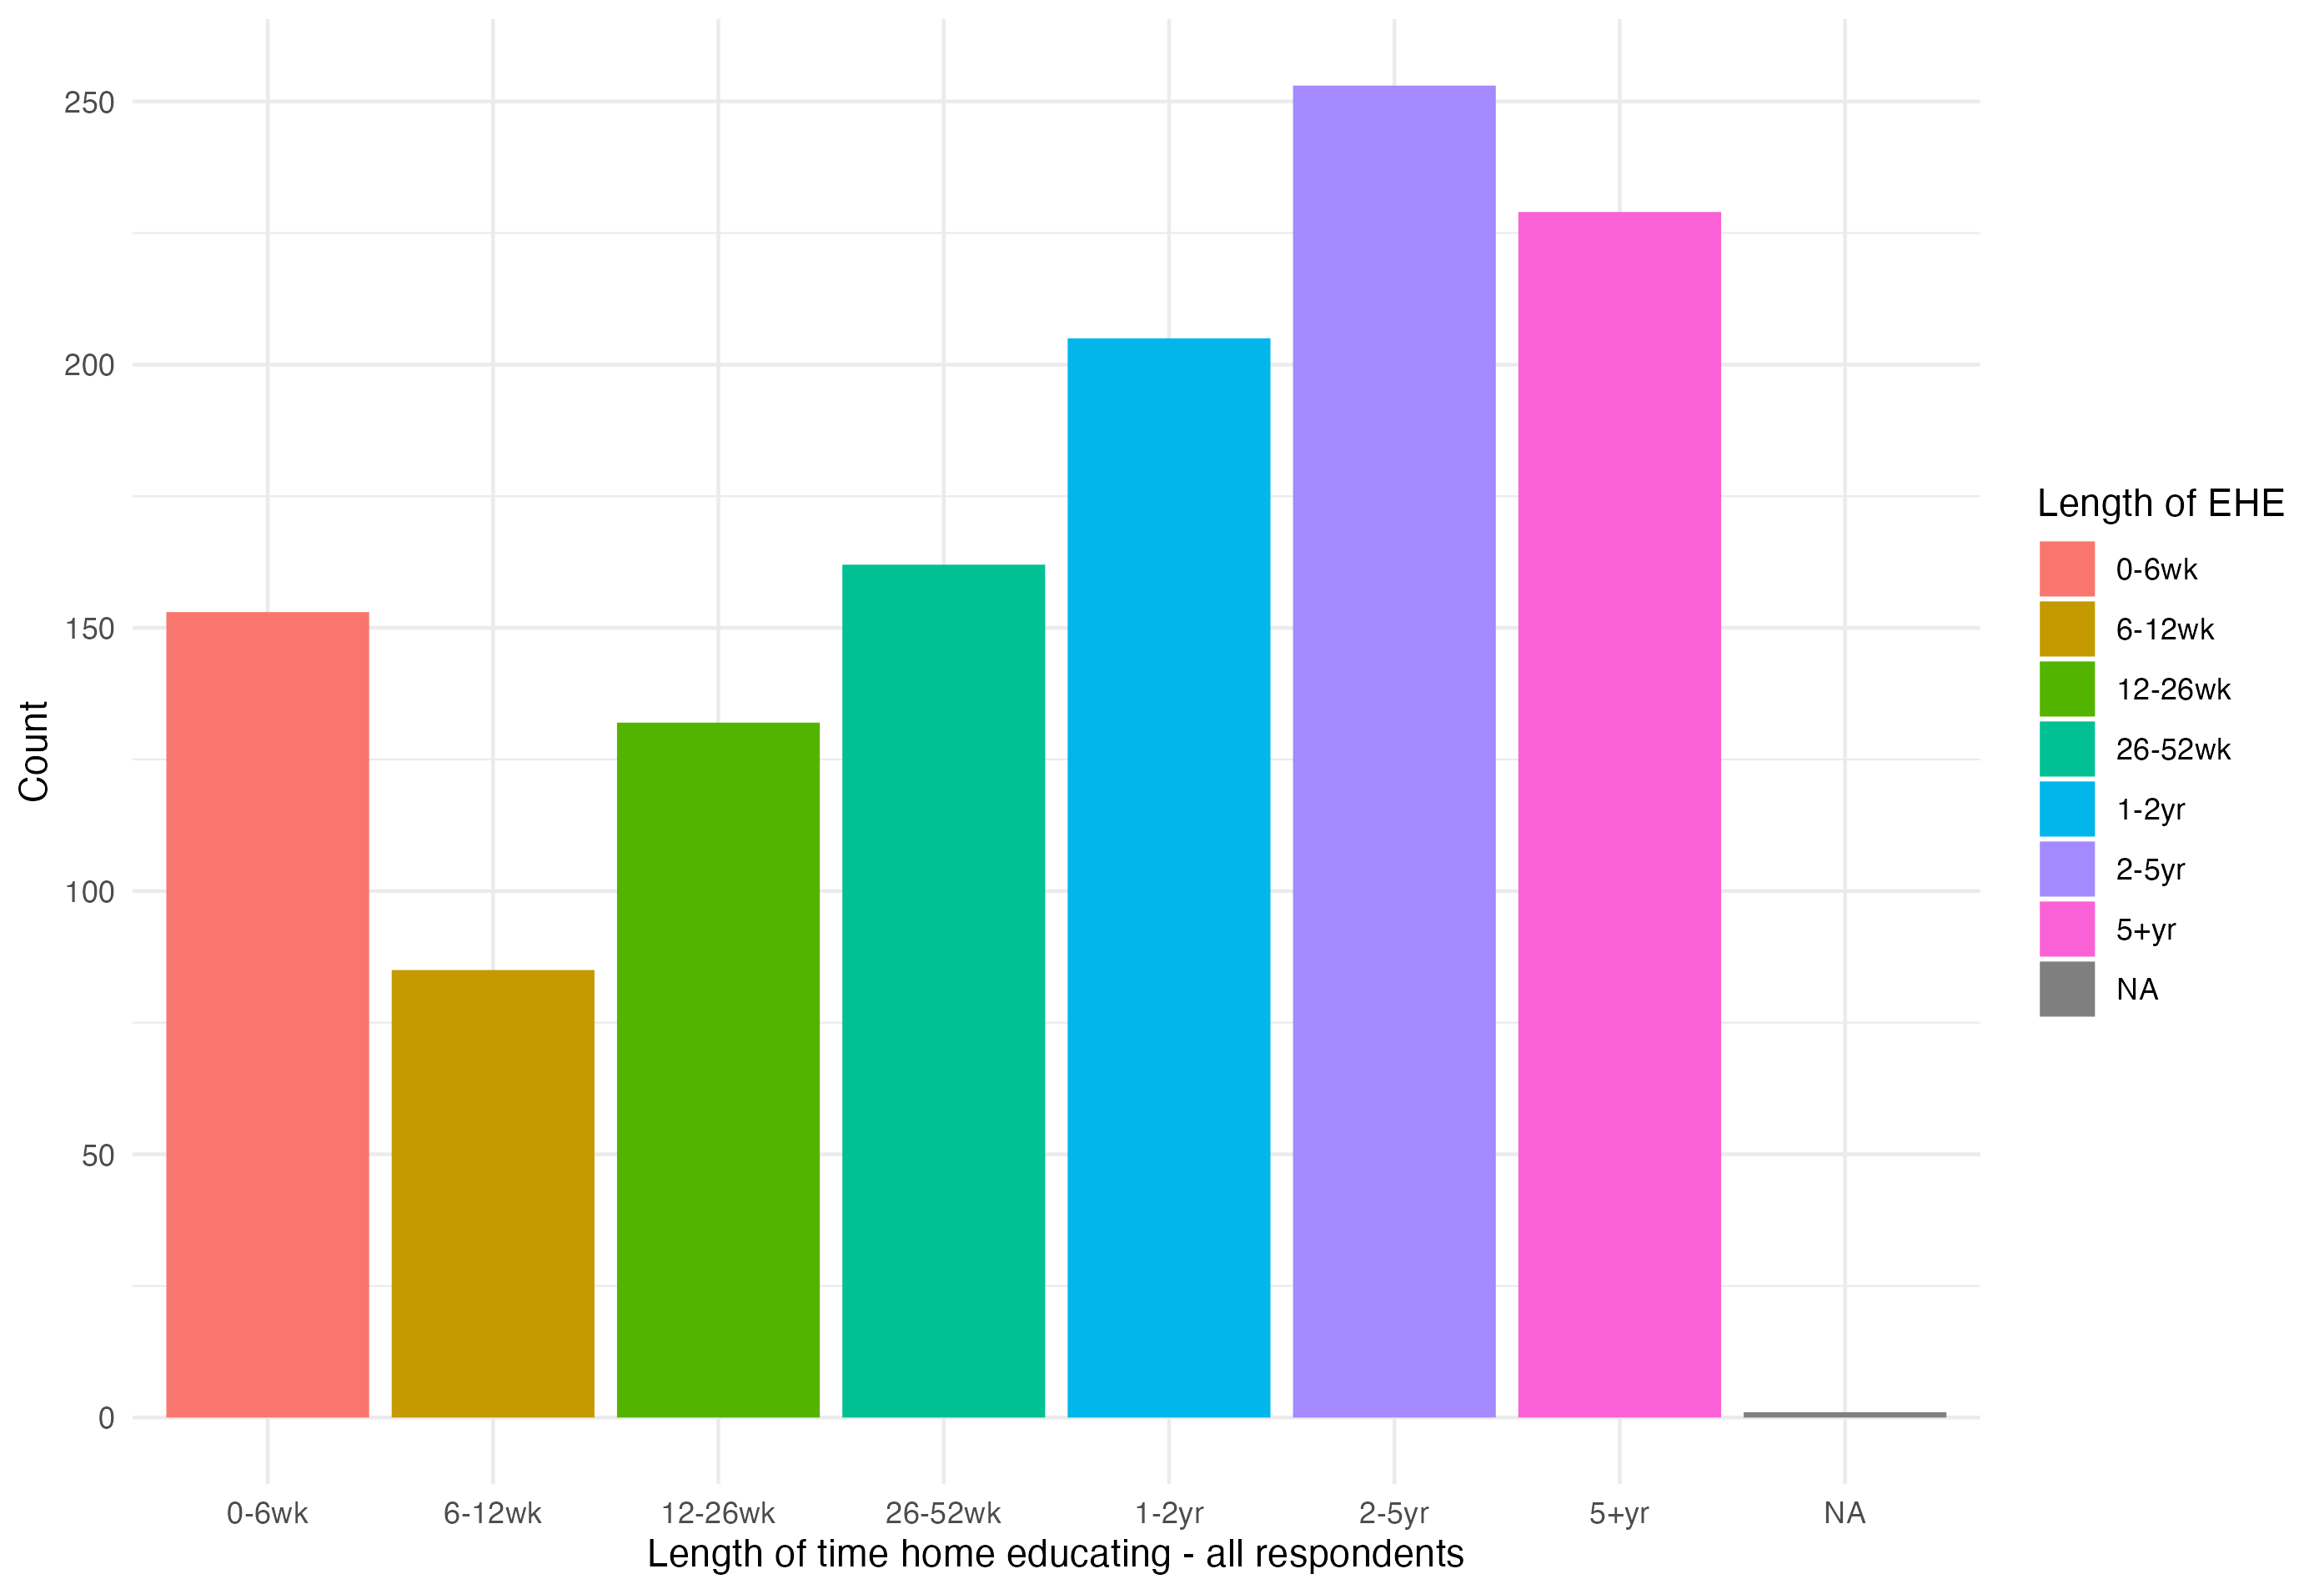
This shows that many families in this survey are recently deregistered - 532 of the 1220 respondents had deregistered within the last year, and 153 within the last six weeks. This fits with other data sources that show a high level of ‘churn’ in the home educating population; including the DfE Academic year data from 22-23, which shows 53,200 home education ‘starts’ from a maximum population of 126,100 children who were home educated at any point over the year (note that this is a 'start' from the point of view of a Local Authority, and so includes children who move into the area, even if they had already been home educating). The DfE data also shows significant term-to-term increases in population, particularly in the secondary years.
It's not clear if this is a general pattern of short term home education, or an overall increase in deregistrations which will be sustained - it is likely to be a combination of both.
This graph shows the length of home education broken down by current age.

And this one shows current age, broken down by length of time home educating.
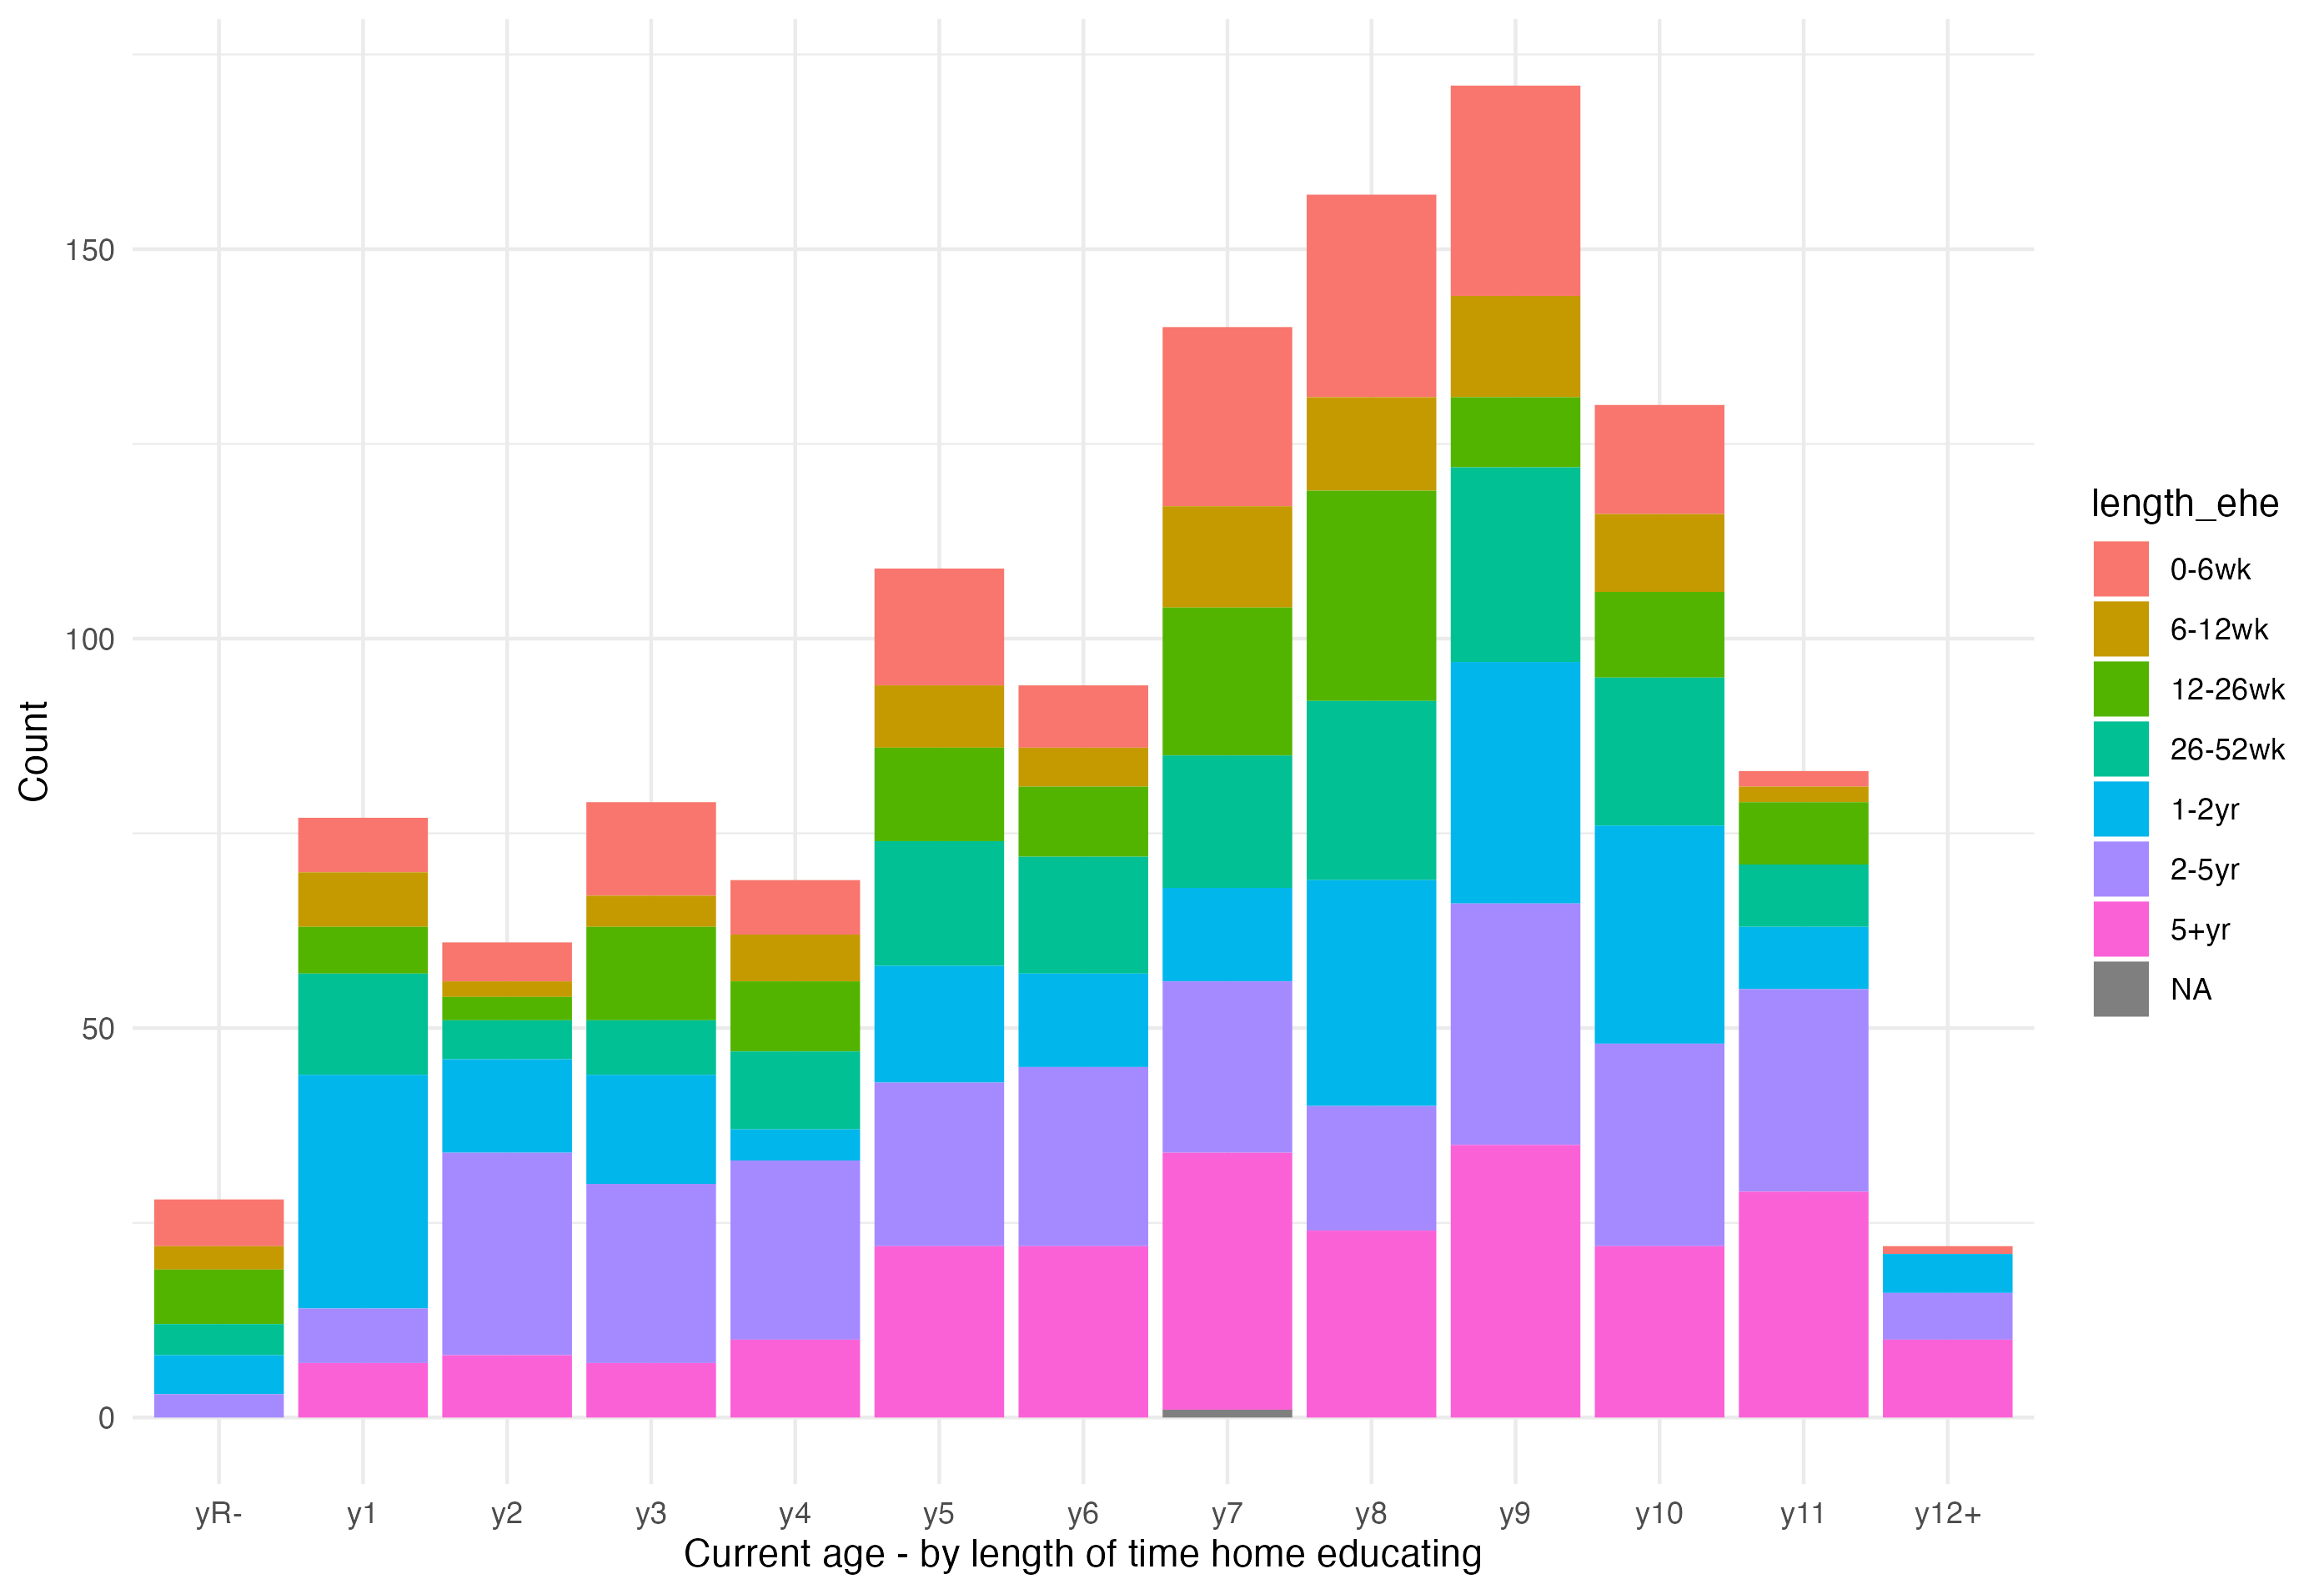
For a stable population, it would be expected that the length of time home educating increases with age. However while there is some evidence of this, it is not a complete correlation, again fitting with the pattern of around a 25% stable population, and then deregistrations (increasing in secondary years) and potentially shorter term stints of home education.
As this survey does not capture children who return to school after a period of elective home education, it’s not possible to use this data alone to suggest what proportion of families home educate for a short period; it could be that the high number of recent deregistrations points to an overall increase in the population, who will continue to home educate long term; or it could point to a high proportion of short term periods of home education.
The DfE academic year statistics capture the number of children who return to school (or other LA controlled education such as AP or EOTAS) after home education - at 19,800 out of a maximum population of 126,100 this suggests a relatively high return rate. The DfE data does not capture the age of children returning to or starting school, or the length of time they were home educated for before returning or starting.
Next: we’ll look at the primary reasons families give for home educating, how this compares to the DfE data, how this changes over time, and how this varies with the age the child is when home education begins.
Thanks for this Katie. But I'm suprised you used school year groups to classify Home Ed kids! Why not just age? I'm looking at the graphs and have no idea how old those kids are and where mine fit in LoL.