A look at the DfE EHE census for 22-23
Another twitter thread that will be far easier to read in long-form.
I’ve been playing with the newly released summer term EHE stats from the DfE. We now have a full year of data from English LAs, with a pretty good (~95%) response rate. The DfE have more info than they publish, but let’s see what this tells us.
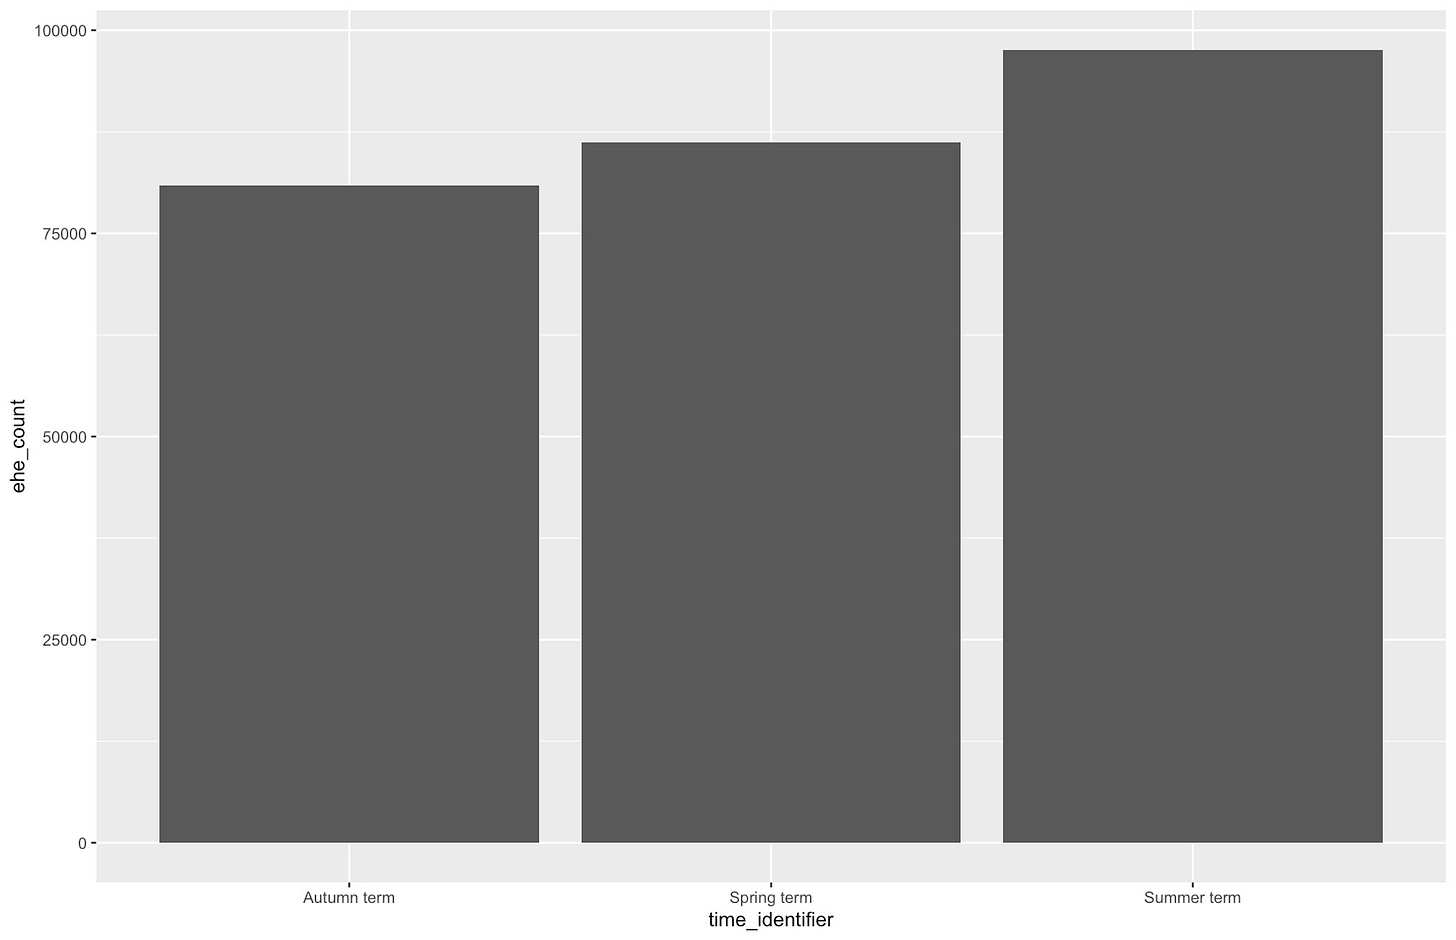
Total numbers of EHE children known to the LA are now just under 100,000. This has grown over the year, which is as expected - deregistrations happen over the year. Some go back, but most stay and add to the numbers. This will drop by >15,000 over the summer as y11 age out.
There are about 9 million pupils in England so this is a bit over 1%.
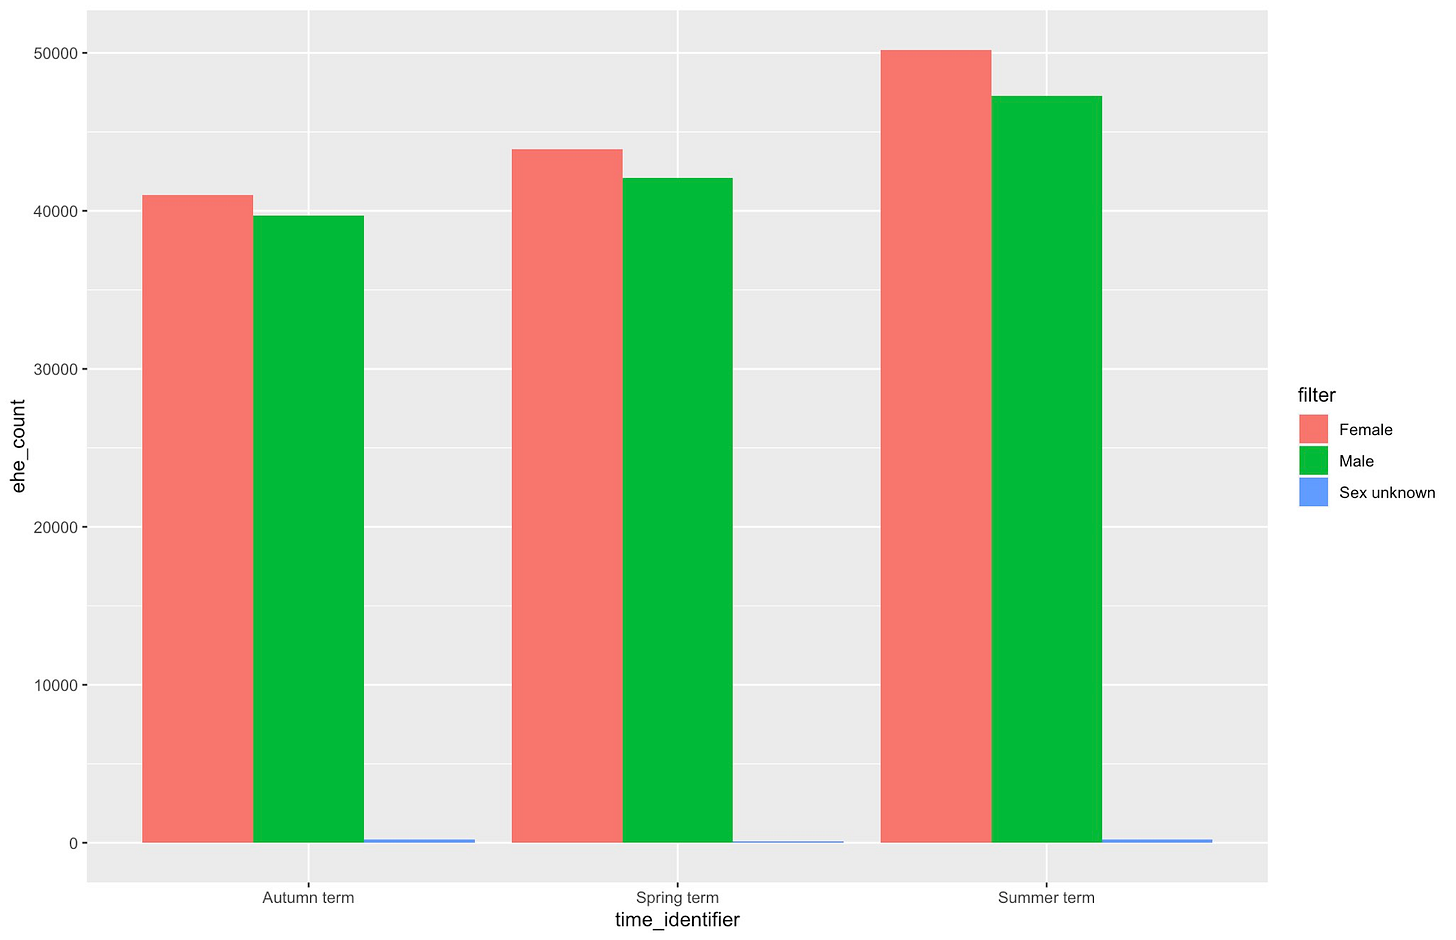
Breakdown by sex is not very interesting - slightly more female than male, both increasing at fairly similar rates.
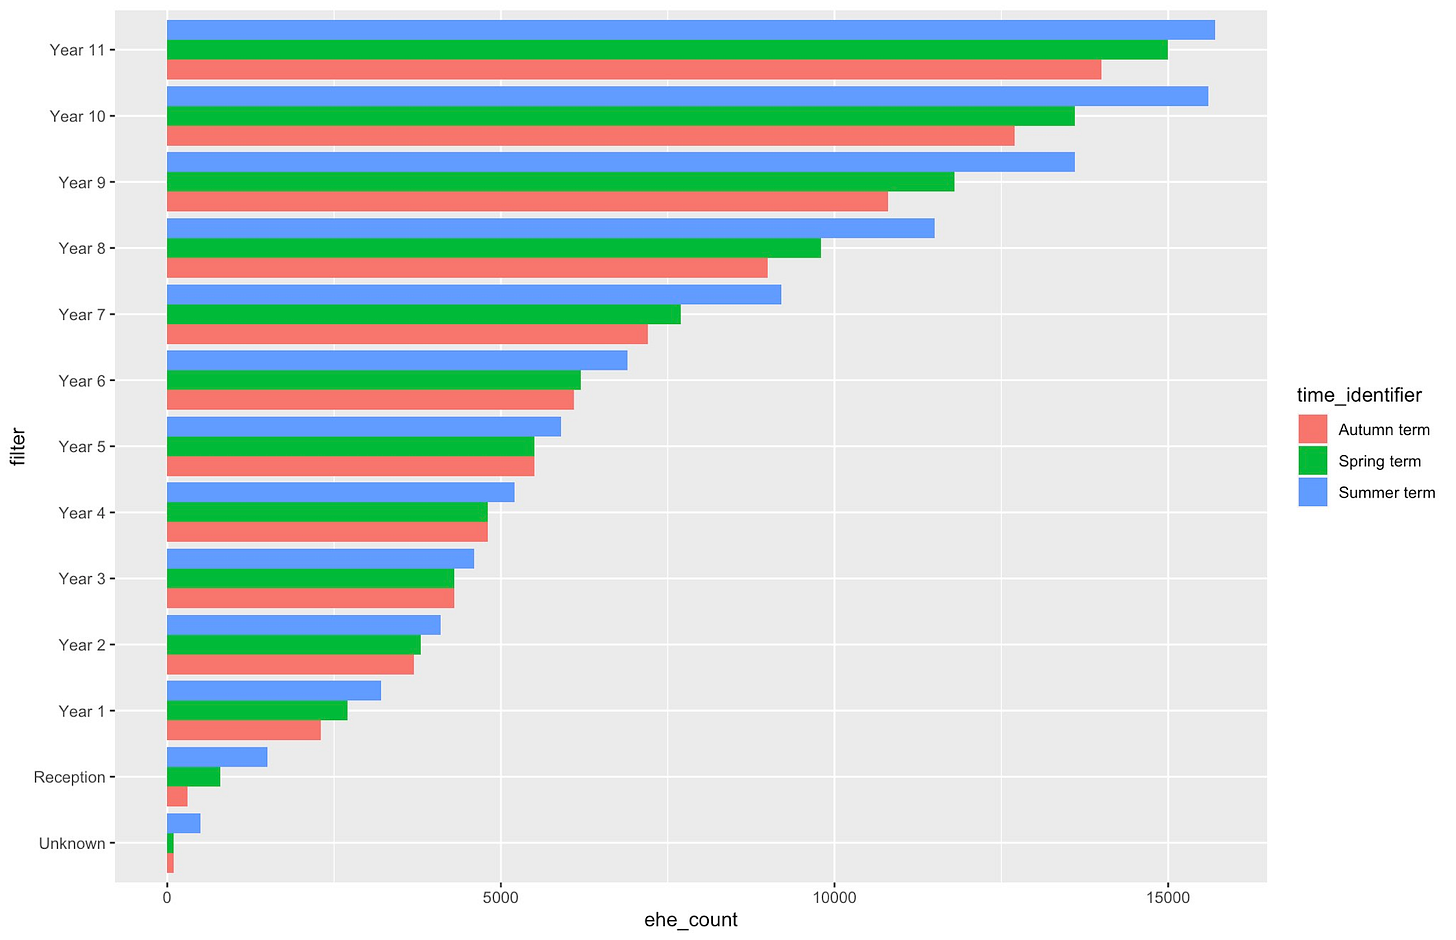
Breakdown by year group throws up some interesting observations. Numbers increase significantly by age. This surprised me initially, but it shouldn’t have. Assuming more deregistered children remain home ed than go back to school, an increase over time is what you’d expect.
However the curve isn’t even - there is a greater increase in home ed numbers through secondary than through primary.
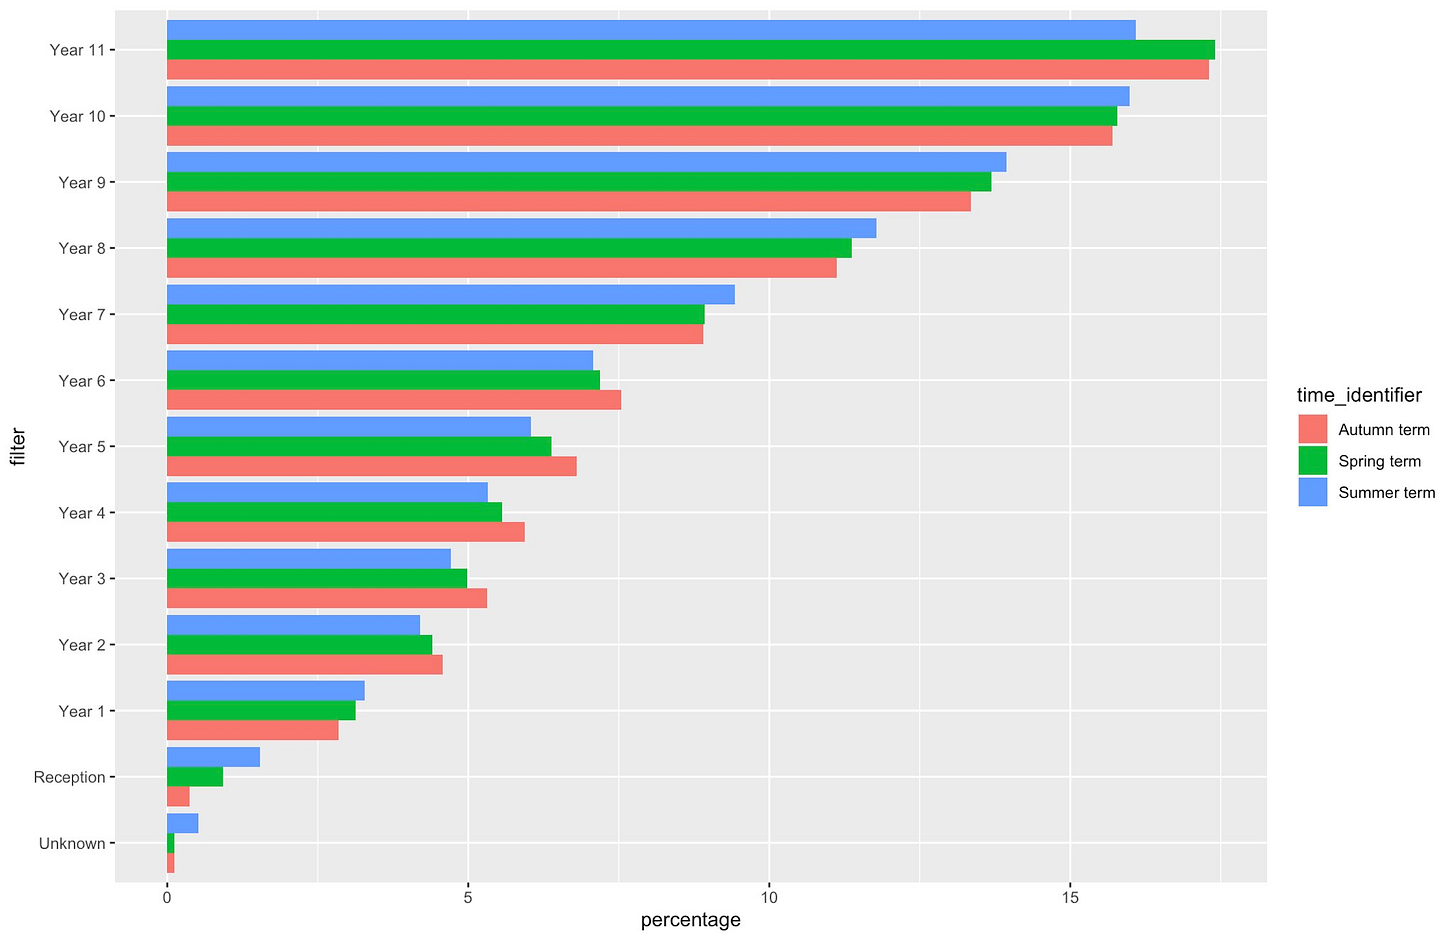
It looks like there are years that provoke more of an increase than others too - y3, 4 and 5 barely shifted from autumn to spring. However the overall increase term on term makes this hard to see. Let’s look at year groups as a percentage of the total EHE numbers.
This has some more interesting patterns. Year 11 percentages drop off in the summer term - not wanting or needing to dereg close to exams perhaps, so more year 7-10s become home ed while the other years stay relatively stable.
Reception jumps up significantly term on term but that is partly an artefact of Compulsory School Age starting from the term after a child’s 5th birthday, and not from the September of reception year.
Year 1 is the only primary year that increased its percentage share of EHE students over the year. (Remember, in absolute terms, y2-6 did increase; but not by as much as in secondary.)
We can’t actually tease out deregistrations from continuing home ed in these figures, because we know from the overall data collected for 21-22 that there is a lot of in and out. So this is about general trends.
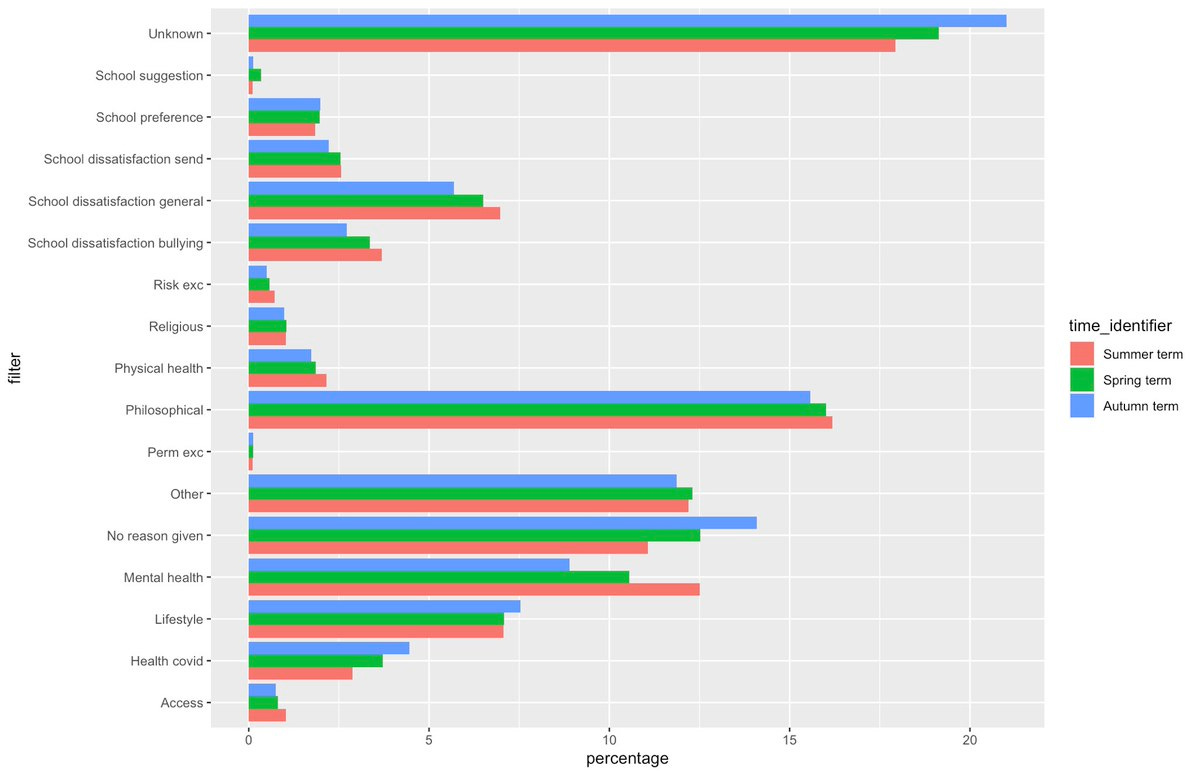
Finally - for now at least - the reasons given for home educating. I’ve shown these as a percentage of the overall population for each term, not in absolute terms.
First, some caveats.
- There are a lot of unknown/no reason/other responses. Almost half, in fact. Although, this did drop over the year, possibly because both LAs and parents knew this data was now being collected and so might be useful.
- There are fixed DfE categories to choose from, which might be tricky to fit to an individual, no doubt highly complex, decision. And it is the LA deciding; it may be that parents would not have agreed with the categorisation.
- I don’t know when these reasons are assigned, and if they are updated over time. It could be that the initial reason for home educating in y3 was bullying; but over time it turned into a positive choice (either philosophical or lifestyle - I don’t know what they mean either ;))
However, philosophical and lifestyle reasons - basically, we want to - are coming in at 20ish percent. Remember there are only about 50% clear reasons given; so that’s 4 in 10 of the clear reasons being positive.
School suggestion - explicit ‘off rolling’ - is very low. But remember, this is the reason the LA has recorded, and they might have reasons to prefer another option if it might fit.
Mental health is given as the reason for home education in about 1 in 4 times that a clear reason was stated. This showed the biggest increase over the year (which could potentially be people wanting to give it as a reason when they hadn’t before).
School dissatisfaction due to SEND is relatively low, and far lower than other surveys of home educating parents. It could be that SEND is an underlying factor in other reasons, such as mental health, bullying or general dissatisfaction.
Altogether school dissatisfaction is about 1 in 5 of the clear reasons given. Not getting a preferred school could arguably also count as being dissatisfied with the school where a place _was_ given. (‘Access’ should be used where the child just couldn’t get to a school).
Covid as a reason went down over the year. Physical health slightly increased. Both were higher than religious reasons.
Permanent exclusion was very low; risk of exclusion higher but still a relatively small number of the total. With this there may be an element of parents, or LAs, not wanting to give it as a reason.
There are still a lot of questions here, some of which are frustratingly close but unable to be answered by the dataset that gets collected. Some the DfE do have data for, but haven’t released, possibly as it relates to protected characteristics.
However over time I think these stats, and also the overall yearly information, will be really interesting.
Data available here if you'd like to play too: https://explore-education-statistics.service.gov.uk/find-statistics/elective-home-education


